Thought Leader Thursday: Seven Mistakes to Avoid in Getting a Fit
I apologize to anyone who found this post searching for exercise tips. This is not going to be about physical fitness, but it will give your mind a mental workout on using data and math for engineering problems. Okay, let’s begin with some simple stretching exercises to get our brains focused. Imagine having collected a lot of data (virtual simulation, physical testing, etc). Regardless of the data’s source, it is an imposing collection of rows and columns of numbers: input and outputs. So how do you learn from this data?
The data set’s usability can be extended to perform “what-if” investigations by predicting the outputs at inputs for which you have no data. This concept of predictive modeling goes by many names: response surface, meta-model, approximation. In Altair’s design exploration software HyperStudy®, we call this a “Fit” approach because the math model is intended to “fit” the data. Creating a good quality Fit can be as challenging as getting physically fit, if not more. Anything from the mathematical properties of the data to the method used will impact the Fit’s quality. Every problem is unique, but here are some best practices to keep in mind:
Use more than one metric to judge quality
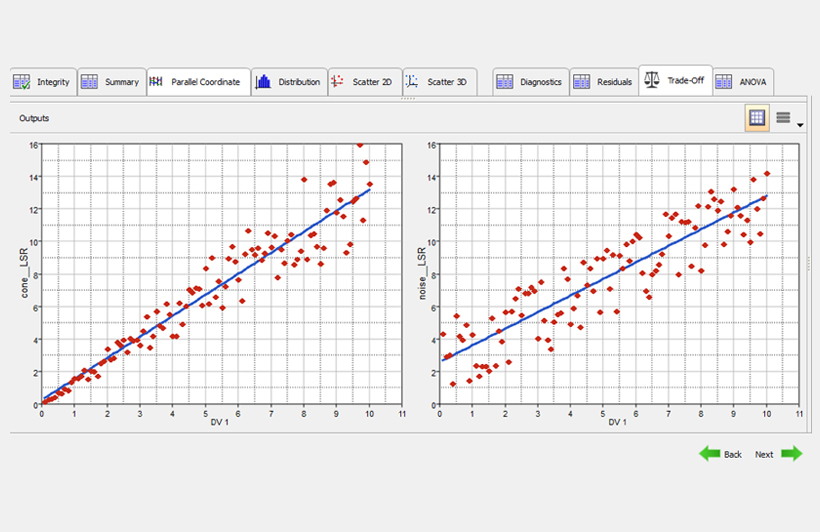
There are multiple ways to check the accuracy and validity of a Fit. It is better to learn several, and not fall in love with any one. As an example, consider the plots below that shows two different data sets and their corresponding linear regression Fits. The left Fit has a higher R-squared value than the right plot (0.9 to 0.8), which is generally desirable. However, the right plot has a lower maximum error. If you want to find solutions that have small response values, the left system is better because of the very low errors when the response is small. Conversely, the right plot makes better predictions at large response values. No one metric tells the whole story. Understanding how to value multiple metrics within the context of your project goals is always beneficial.

Avoid extrapolation
This one should is pretty simple. If you collect all your data about apples, then you probably should not use it to make predictions about oranges. Your Fit can surely make predictions about oranges, but it is based on insufficient information and it is entirely up to you to justify any choice to believe it is valid.The danger of overfitting
It can be tempting to react to a poor quality Fit by creating a more complicated model, for example using more variables or increasing the number of regression terms. There is always a sufficiently complicated model to fit any data with zero errors, for example high order polynomials. However, these more complicated functions can be highly non-convex consisting of undulating waves. But physical phenomena infrequently exhibit such behavior. The mathematician George Box once said, “All models are wrong but some are useful.” This profound statement means that the goal is not to remove errors at all costs; that is unrealistic. The true value of the Fit comes from its ability to provide predictive value within your required accuracy.Investigate outliers
An outlier is a piece of data that doesn’t appear to be like the rest of the data, statistically speaking. It can be tempting to set aside this data as it can have a negative impact on the overall quality of the Fit. There are certainly many cases where this makes sense, but the outlier should be investigated before being excluded. The outlier may be an indication of an unknown flaw in the process or a critical combination of variables that produces a unique result. Only after the outlier has been understood should it be ignored.One size doesn’t always fit all
This can be a simple oversight in problems with multiple outputs. The best choices to fit one set of output data is not necessarily the best choice for another. For example, the mass of a sheet metal part is a linear function of the thicknesses, but the stress may not be so simple.The value of detailed output responses
It is so simple and easy to identify outputs that don’t provide much use by having too large of a scope. Take the maximum global stress in a part that consists of several designable radii and thicknesses. The maximum stress in the part will be a highly complex function of all the possible inputs. In contrast, think about the stress near a fillet. It will be mostly only a function of the fillet radius and the thickness in that area; this response could be captured with simple functions and limited data. Apply engineering judgement to focus on areas interest rather than settling for a generic global value.Use validation data
Least squares regression models are self-diagnostic based on input data alone, but most other methods are not. Interpolation schemes that pass identically through each point will not show any errors at all! When building a Fit, it is always best practice to hold back some data to test the Fit. Using a validation set of 5-10% of the input size is a good rule of thumb. This will provide the most reliable measure of confidence in your Fit’s predictions.


