Panopticon Demo: Visualize your Order Book with Full Depth

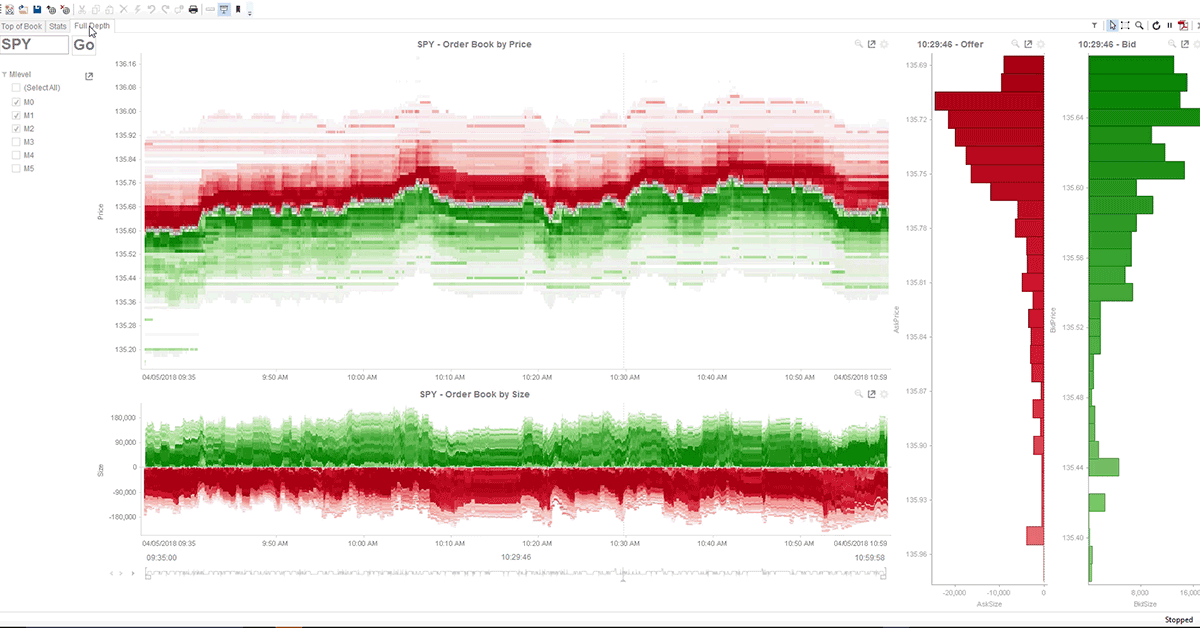
Panopticon enables traders to visualize their Order Books at full depth. While looking at Top of Book to see the spread across time is useful, traders can't see what's happening at depth unless they use much more sophisticated visualizations, as demonstrated in this video.
Viewing full depth stats across the a selected period makes it easy to understand what is actually happening with trades. Traders can grouping depth into multiple buckets (in order example, ten buckets) and calculate total size, size imbalance, spreads, and size-weighted average bids and offers down the book, at each level of depth. They can see where the book widens and narrows, where the book is balanced, where there are size imbalances, and where orders are more mixed. They can also see how the best spread correlates to the weighted average spread across the book.
This approach is especially useful when making comparisons between different instruments. Traders can easily see anomalies in book depth across the market, and how those anomalies change over time, down to the nanosecond level.
This dashboard also enables users to see what sort of strategies other firms in the market are trading; for example, is a rival firm's strategy focused on market making or is it continuously moving liquidity between both sides of the book? Is it sporadic in its order flow? Does it look like spoofing?
In this video, we are looking at trading activity for equities, but the system supports all asset classes and quants, traders, and compliance officers can visualize order books for fixed income, derivatives, commodities, and foreign exchange instruments with equal accuracy and depth.
