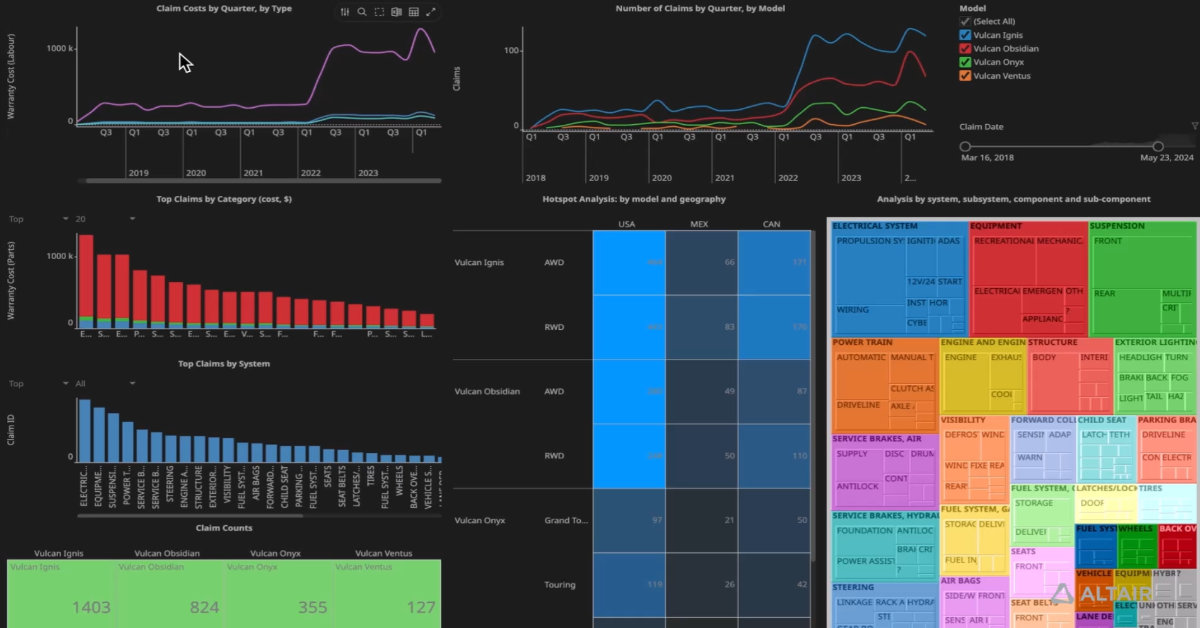
In this short video, see how a warranty analyst working for an automotive manufacturer can visually analyze data on the company's warranty exposure. The dashboard uses several different visualizations, including heatmaps, treemaps, bar graphs, and line graphs, to enable users to identify emerging trends and hotspots, and perform root cause analysis through the software’s clever filtering and drill down capabilities.
Have a Question? If you need assistance beyond what is provided above, please contact us.