Digital Debunking: Could Drafting Really Improve Fuel Efficiency on the Highway?
Co-Authored by Altairians Jason Craanen and Nicolas Zagorksi
If you’ve ever watched professional racing, one of the first things you may notice is how closely the drivers follow one another. Running bumper to bumper is a strategic method known as drafting. It enables the driver to enter the leading car’s aerodynamic slipstream in an effort to reduce the drag force on the vehicle, using the distribution of air pressure to improve fuel efficiency.
Then we began to wonder, could this racing technique apply to a motorist on the highway? Could drafting behind a big rig or semi-truck really improve a car’s fuel efficiency?
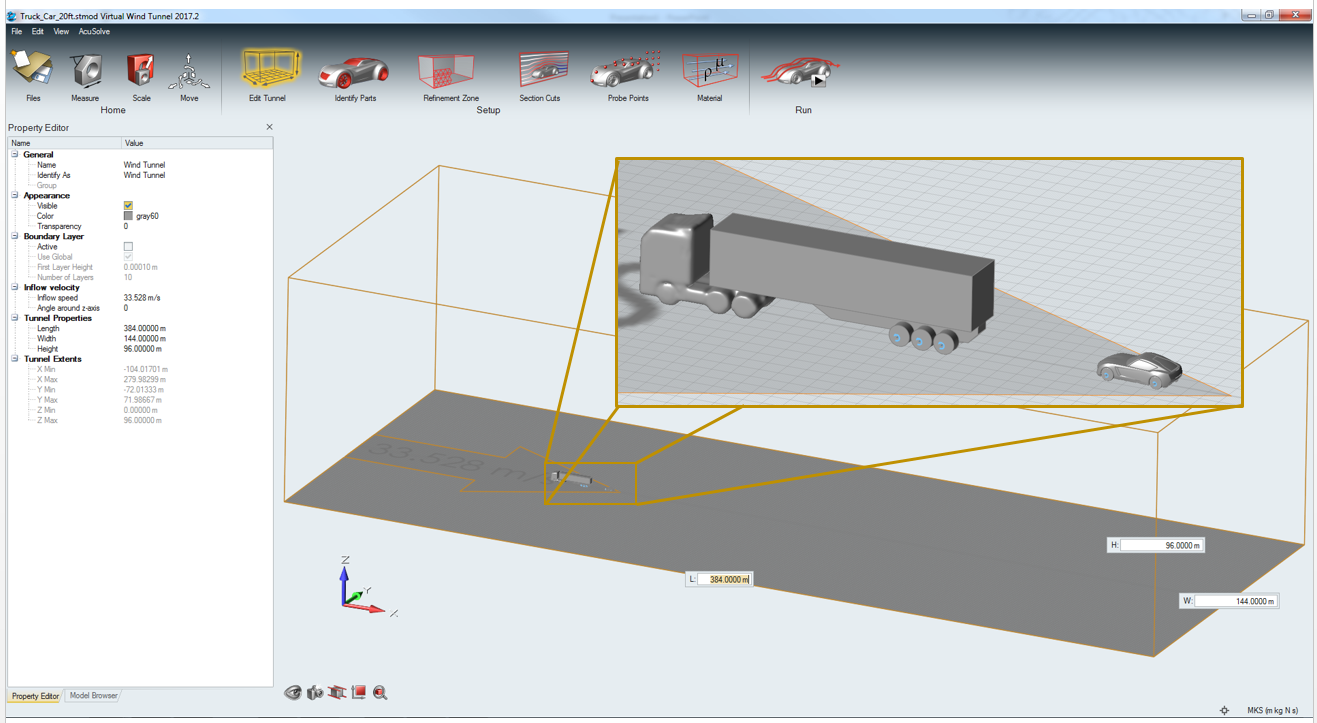
The closer you follow, the more benefit you get from the drafting effects, but obviously, this is highly dangerous to perform on the road. Instead, we tested our theory from the safety of our computers by turning to the Altair Virtual Wind TunnelTM (VWT) simulation tool to perform the experiment.
Using generic data of a car and truck, VWT allowed us to quickly and simply build a numerical model that led us to determine the air pressure distribution on both vehicles when they both travel at 75 mph. The animation below shows the air flow around the car and truck and emphasize the zone of pressure reduction in blue (Figure 2).
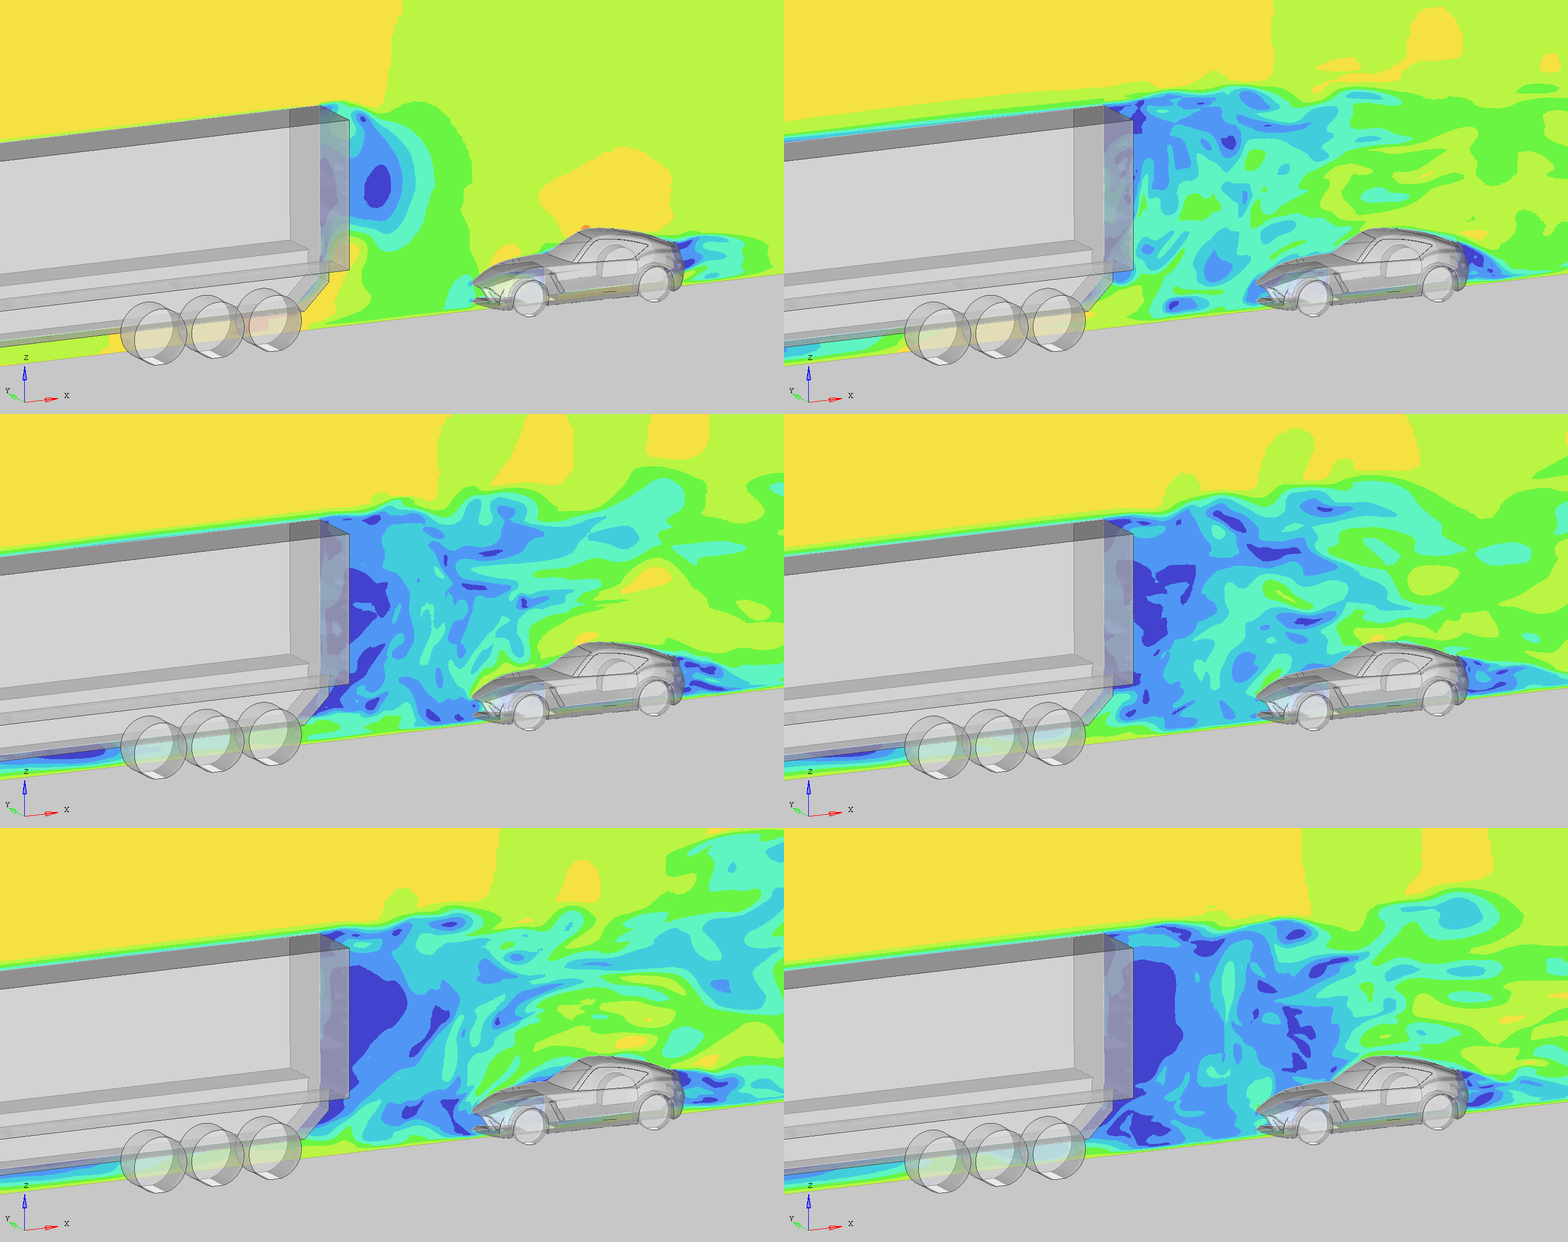
In VWT, it was easy to change the distance between the two vehicles to see its effect on the pressure distribution. In Figure 2 you can see the pressure distribution for 5ft and 333ft, which is the recommended safe following distance at 75 mph, using the 3-second rule. Also included for reference is a case with no truck.
These results indicate that the pressure distribution on the car changes drastically between “Car only” and “5ft following distance” with an overall reduction in magnitude. The high-pressure zone shown in red on the front of the vehicle, is significantly reduced too. The results between “Car only” and “333ft distance” are very similar as it shows the car is far enough away that it is not affected by the truck.
This relates directly to the drag force, which is calculated by summation of all the forces on the vehicle that those pressures generate.
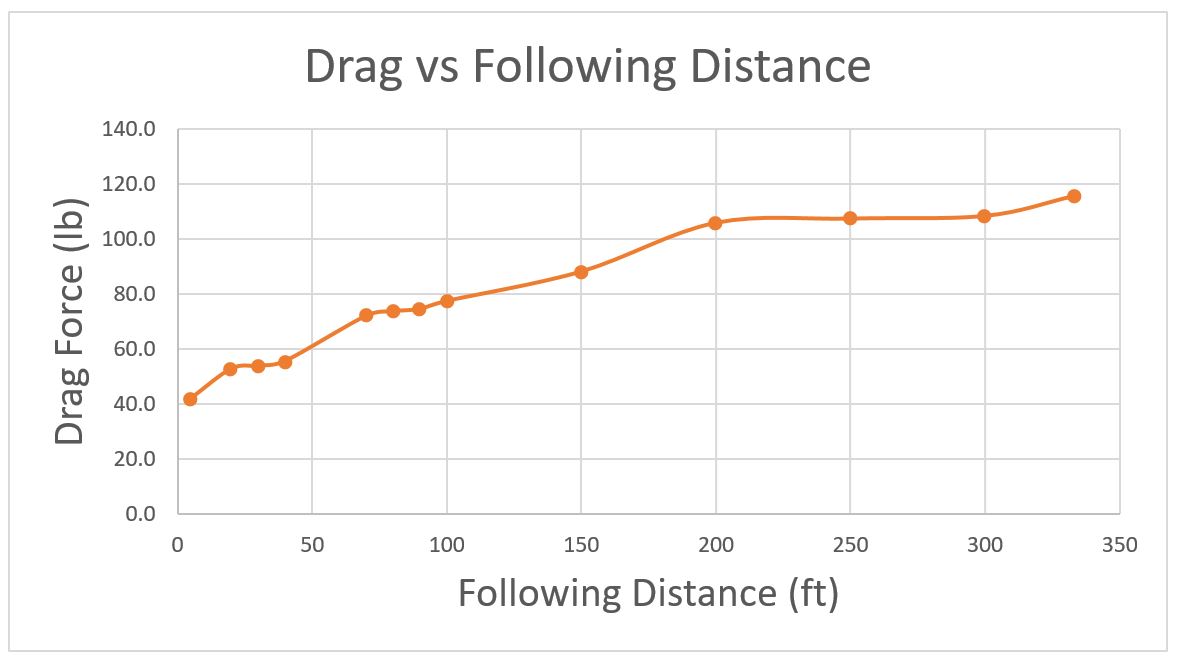
By evaluating several distances between 5ft and 333 ft, the following graph of the drag force vs distance was created. This graph clearly shows the effect of the following distance on the drag force, but also the fact it is not a linear phenomenon.
But, drag forces only tell part of the story.
Most passenger vehicles on the road today produce lift at highway speeds. Lift is the same force that allows airplanes to fly. In a car, a large amount of lift may make the car feel unstable because it actually unloads the tires which make contact with the road.
The graph below shows the lift force vs following distance, and it shows a similar trend as the drag force.
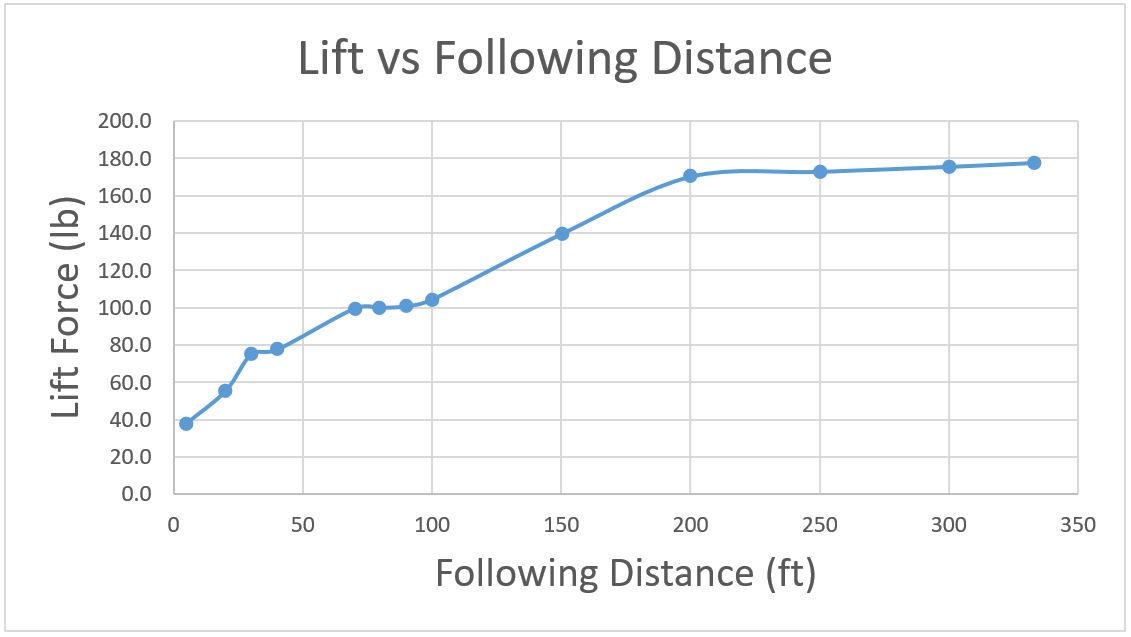
Altair’s Virtual Wind Tunnel allowed a determination of the drag and lift forces, and by doing a parameter study, we were able to confirm our initial assumptions. Both drag and lift can be reduced by decreasing the following distance behind a truck. However, to get any noticeable reduction in energy expenditure, you would have to follow at an unsafe distance for a human driver’s reaction time. To gain any benefits in fuel economy, you would be putting yourself in danger of a collision if the truck came to a sudden stop. This theory is validated, but please don’t try this at home!

If you want to learn more about Virtual Wind tunnel, please visit our website.
If you’ve ever watched professional racing, one of the first things you may notice is how closely the drivers follow one another. Running bumper to bumper is a strategic method known as drafting. It enables the driver to enter the leading car’s aerodynamic slipstream in an effort to reduce the drag force on the vehicle, using the distribution of air pressure to improve fuel efficiency.
Then we began to wonder, could this racing technique apply to a motorist on the highway? Could drafting behind a big rig or semi-truck really improve a car’s fuel efficiency?
The closer you follow, the more benefit you get from the drafting effects, but obviously, this is highly dangerous to perform on the road. Instead, we tested our theory from the safety of our computers by turning to the Altair Virtual Wind TunnelTM (VWT) simulation tool to perform the experiment.
Using generic data of a car and truck, VWT allowed us to quickly and simply build a numerical model that led us to determine the air pressure distribution on both vehicles when they both travel at 75 mph. The animation below shows the air flow around the car and truck and emphasize the zone of pressure reduction in blue (Figure 2).

In VWT, it was easy to change the distance between the two vehicles to see its effect on the pressure distribution. In Figure 2 you can see the pressure distribution for 5ft and 333ft, which is the recommended safe following distance at 75 mph, using the 3-second rule. Also included for reference is a case with no truck.
These results indicate that the pressure distribution on the car changes drastically between “Car only” and “5ft following distance” with an overall reduction in magnitude. The high-pressure zone shown in red on the front of the vehicle, is significantly reduced too. The results between “Car only” and “333ft distance” are very similar as it shows the car is far enough away that it is not affected by the truck.
This relates directly to the drag force, which is calculated by summation of all the forces on the vehicle that those pressures generate.
By evaluating several distances between 5ft and 333 ft, the following graph of the drag force vs distance was created. This graph clearly shows the effect of the following distance on the drag force, but also the fact it is not a linear phenomenon.

But, drag forces only tell part of the story.
Most passenger vehicles on the road today produce lift at highway speeds. Lift is the same force that allows airplanes to fly. In a car, a large amount of lift may make the car feel unstable because it actually unloads the tires which make contact with the road.
The graph below shows the lift force vs following distance, and it shows a similar trend as the drag force.

Altair’s Virtual Wind Tunnel allowed a determination of the drag and lift forces, and by doing a parameter study, we were able to confirm our initial assumptions. Both drag and lift can be reduced by decreasing the following distance behind a truck. However, to get any noticeable reduction in energy expenditure, you would have to follow at an unsafe distance for a human driver’s reaction time. To gain any benefits in fuel economy, you would be putting yourself in danger of a collision if the truck came to a sudden stop. This theory is validated, but please don’t try this at home!

If you want to learn more about Virtual Wind tunnel, please visit our website.


