Powerful 2D and 3D Data Analysis and Data Plotting
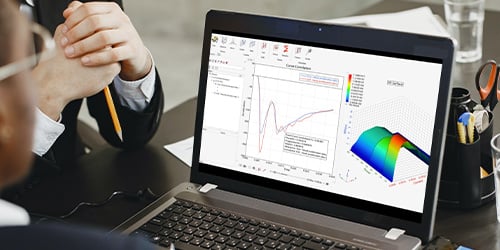
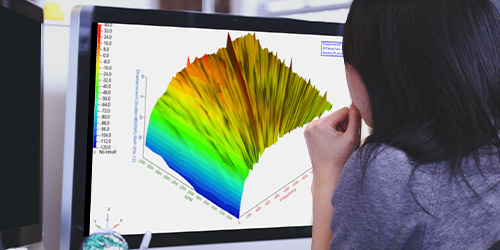
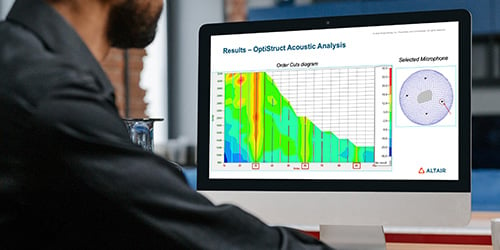
HyperGraph offers a complete data analysis system capable of handling 2D and 3D data with unparalleled ease and efficiency. Our robust suite of process automation tools minimizes manual effort and maximizes productivity.
Broader Solver Support
HyperGraph is compatible with a wide range of solvers, including those from Altair's portfolio and others like Abaqus, Adams, Ansys, and more. This provides a level of flexibility that’s second to none, ensuring that you're never limited in your CAE analysis.
Data Format Versatility
HyperGraph can read over 130 data formats. This remarkable compatibility ensures a seamless data graphing experience, regardless of the data format you're dealing with. It includes several test data formats.
Automatic Plot Builder
Our Automatic Plot Builder generates fully annotated plots directly from engineering data. It automatically assigns axes, headers, footers, legends, and curve properties, creating clear, comprehensible charts and data plots.
Extensive Math Library
HyperGraph features a customizable library of mathematical functions. It allows you to add custom-defined math functions to Altair’s already robust math library, providing you with all the tools you need for advanced CAE analysis.
Reusable Report Templates for Standardized Post-Processing
HyperGraph provides access to channels, filter frequencies, and annotations text as parameters in the Report template which helps standardize data analysis and results dashboarding.
Extended Capabilities, Seamless Altair Integration
Connect with Altair's comprehensive ecosystem of products, including Altair Compose® and Altair® HyperView®, to amplify HyperGraph’s capabilities. Seamlessly import, process, and transform data using Altair Compose, while leveraging the interactive visualization features of HyperView for in-depth CAE analysis.
Customized Post-Processing with Command Recording and Playback
By capturing your actions and transforming them into reusable scripts or macros, you can effortlessly recreate analyses, visualizations, and other critical processes with just a few clicks, ensuring consistent results.
High-Quality Report Publishing
Transform your data into captivating visual narratives, including plots and dashboards, with HyperGraph's high-quality data graphing capabilities. Elevate the visual appeal of your reports and presentations, going beyond mere data comprehension to create impressive outputs that enhance the impact of your analysis.


