The Neuber Correction: A Notch Above the Rest for Linear Stress

Background
Fatigue analysis requires stress data from several loadings. There are methods to scale the stresses, since they are linearly related to the amount of force, double the force and stress will double as well IF the system still has linear behavior. For example, if you load a pencil with 10kg there will be stresses and some deformation. If you load a pencil with 20kg, the pencil will break instead of having double the stress and deformation. There are two ways to solve this problem, the first is to do a nonlinear stress analysis with a complex material model (wood surrounding some graphite) which would take a lot of analysis time. Or, you can stick with the simple linear analysis then do a Neuber correction and judge the new stress. Exceeding the yield might cause permanent deformation, whereas exceeding the ultimate tensile strength would cause the system to fail.
For durability analysis, the Neuber approximation is a well-known method to estimate the local elastic-plastic stresses σplast in notches based on linear-elastic FEA stress results σelast.
With the Young’s Modulus E, and the non-linear strain εplast it can be expressed as
Using the Ramberg-Osgood equation for the description of the cyclic stress strain curve,
the non-linear stresses σplast can be computed as the intersection with the Neuber hyperbola ( K´and n´denoting the cyclic hardening coefficient and the cyclic hardening exponent respectively).
The following case study illustrates the applicability of the Neuber method, which is recommended for local plastification only.
ExampleA notched tensile specimen of steel with notch radius 0.7 mm (stress concentration factor α=2.15), was analyzed with an alternating load of up to 40 kN (stress ratio R = -1).
In fig. 1 the stress amplitude at the base of the notch can be seen for the v. Mises and max. principal normal stress. From the diagram it can be seen that the initial notch plastification occurs at approximately 8 kN.
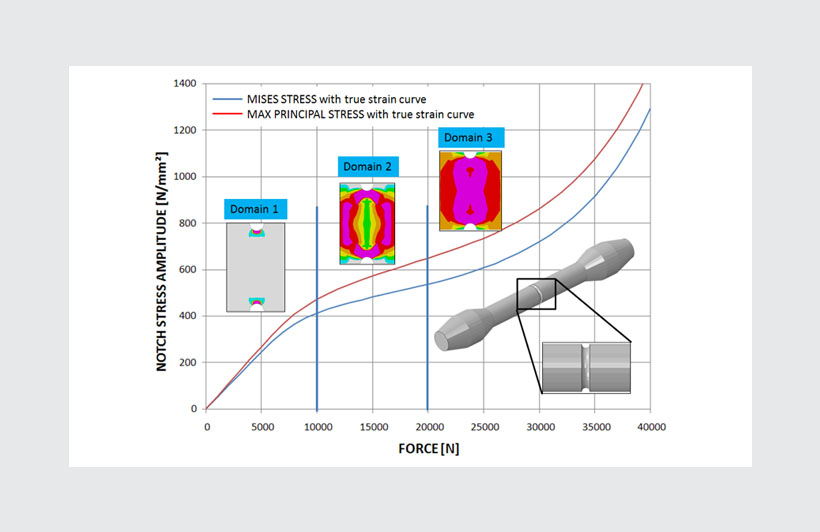
Fig. 1: Notch stress development in the notch base with elastic-plastic material behavior
The following FEA analyses were performed on a fine-grain steel:
- Linear-elastic material behavior and subsequent Neuber correction of the elastic stresses
- Cyclic-plastic material curve and nominal stress-strain definition with non-linear geometry
- Cyclic-plastic material curve and true stress-strain definition with non-linear geometry
In region 1 (0-10 kN) local plastification restricted to the notch prevails.
In region 2 (10-20 kN) the entire cross-section begins to plastify.
In region 3 (above 20 kN) the entire cross-section plastifys.
For our example, the Neuber approximation can be applied up to around 20 kN, because the initial cross-section plastifies only very little up to this limit. Due to the loss of stiffness, there is a large increase in local stresses at a load of 40 kN.
Fig. 2 shows a comparison of the stress amplitudes for the non-linear stresses and the Neuber corrected linear stresses.
From this diagram, it can be seen that for this material the correlation is very good up to a load of about 20kN.
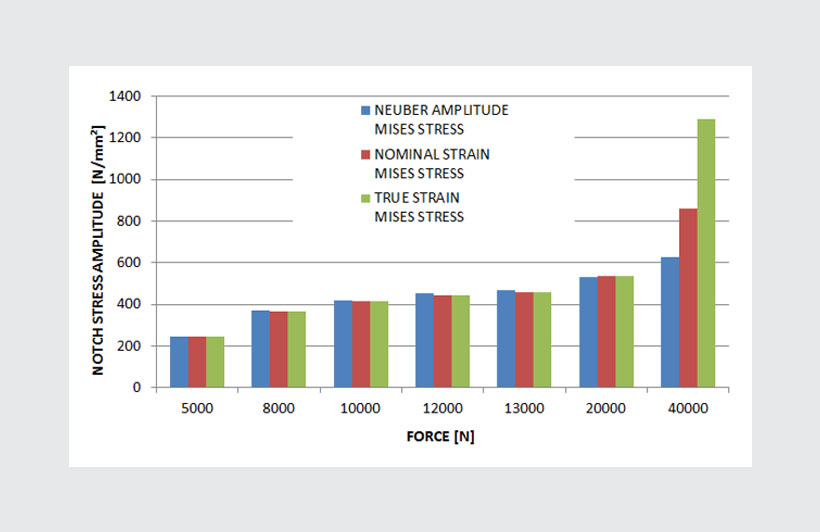
Fig. 2: Comparison of stress amplitudes for elastic-plastic stresses and Neuber corrected linear stresses
Conclusion
Although a multi axial stress state already exists in the notch, the Neuber method provides useful results up to approximately 20 kN (~ 0.6% plastic strain) for the local stress in the notch. If higher strain or stress multiaxiality are anticipated, deviations may increase and a non-linear material law should be utilized.
As long as the load level is smaller than approximately three times the yield level, a lot of CPU time can be saved in durability analysis. This methodology of using the Neuber correction on linear stresses for local plastification is an important option in the FEMFAT fatigue software suite called, FEMFAT plast, which is available through the Altair Partner Alliance.


